Inspecting And Decrypting Private Chrome Extension Traffic
This guide demonstrates how to inspect the network traffic of a Chrome extension and potentially decrypt the exchanged data.
Prerequisites:
- Chrome browser
- Basic understanding of JavaScript and browser developer tools
Steps:
1. Identify Extension Communication
Determine how the extension interacts with its server (background page or webpage injection).
For the webpage
- Open the Chrome developer tools by
COMMAND + OPT + I - Navigate to the Network tab.
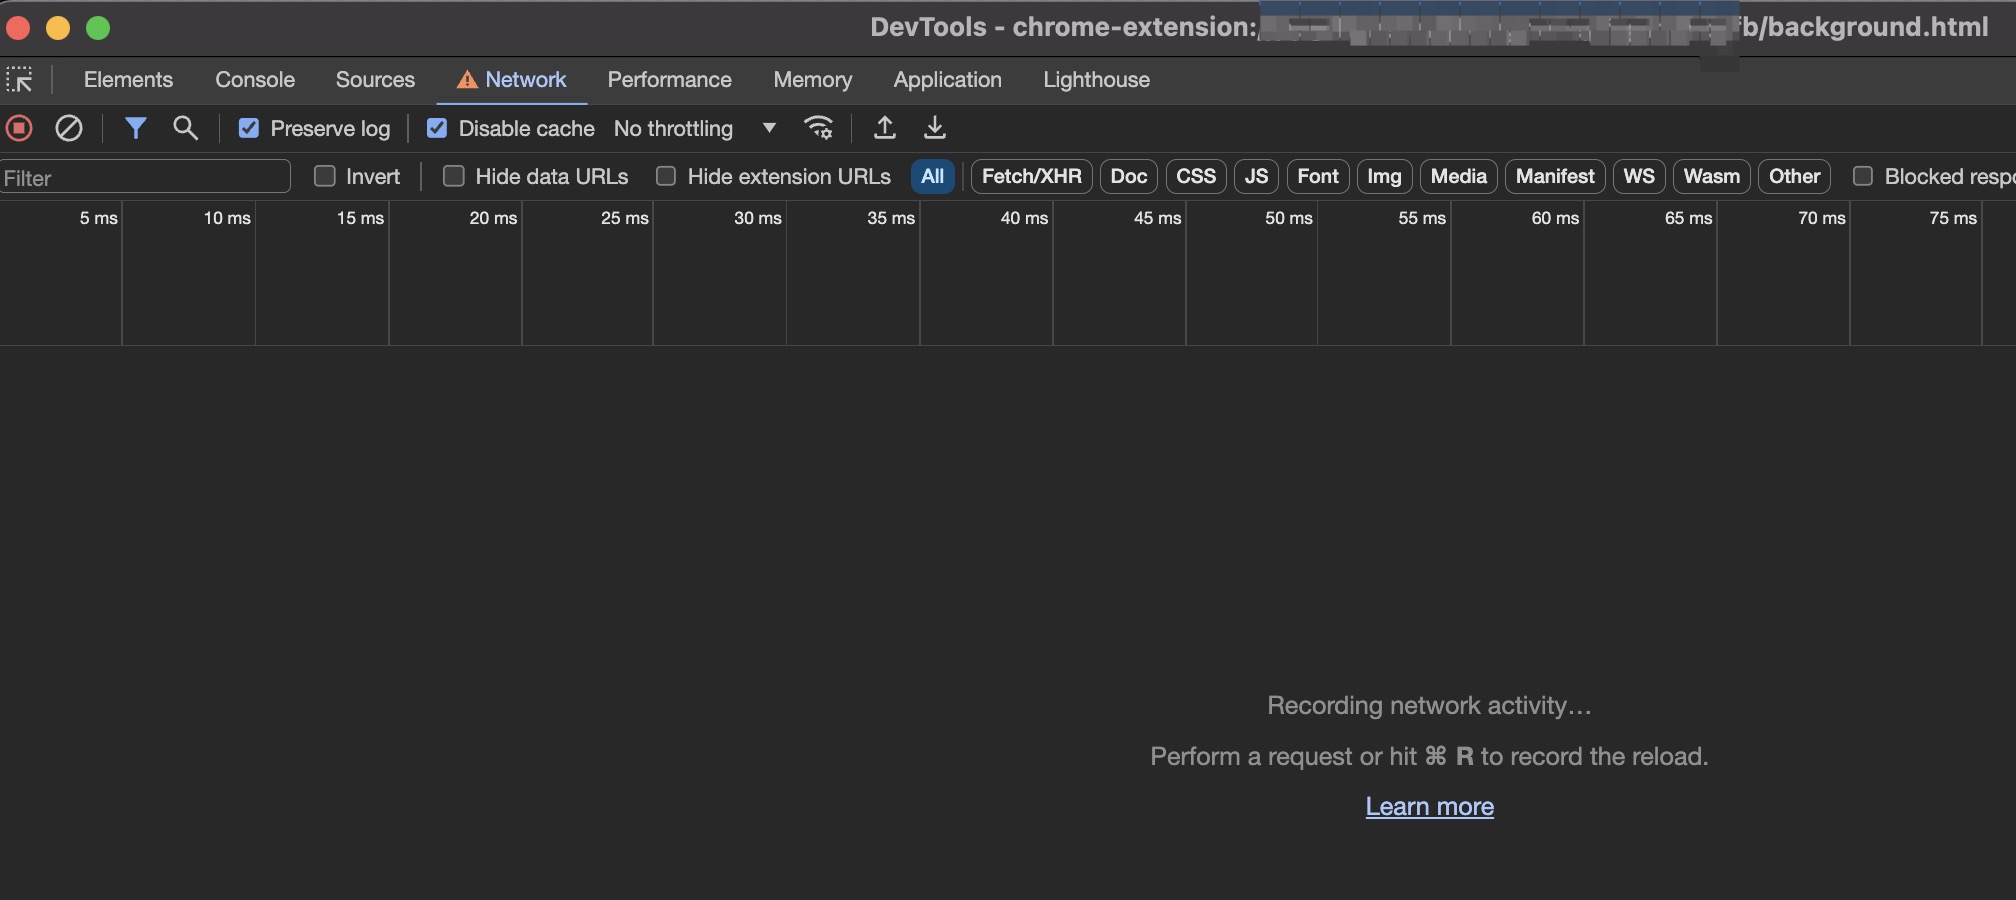
For the background page
- Open the Extensions page (chrome://extensions/)
- Find the extension and click “background.html”
- Navigate to the Network tab.
2. Trigger Communication (if necessary):
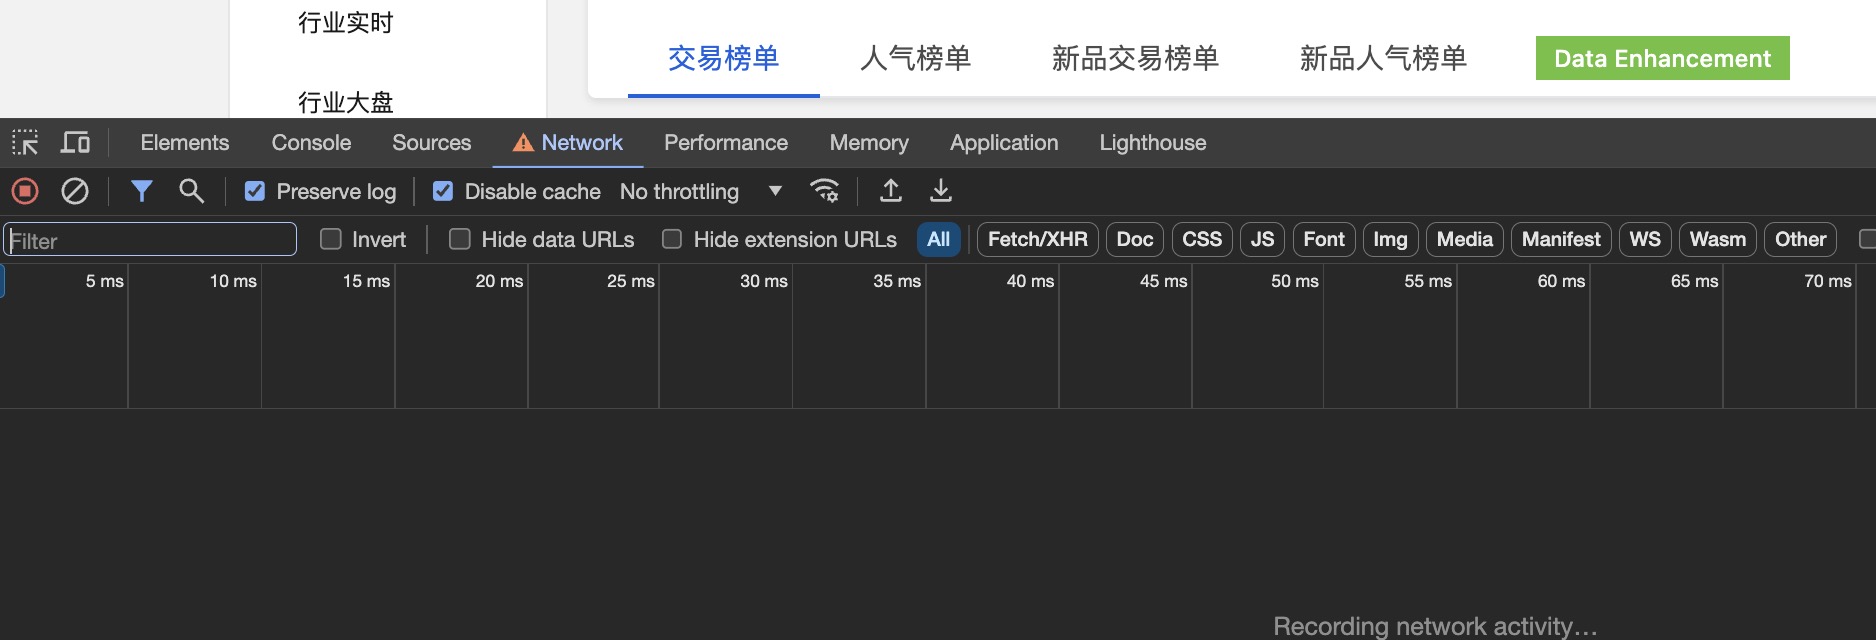
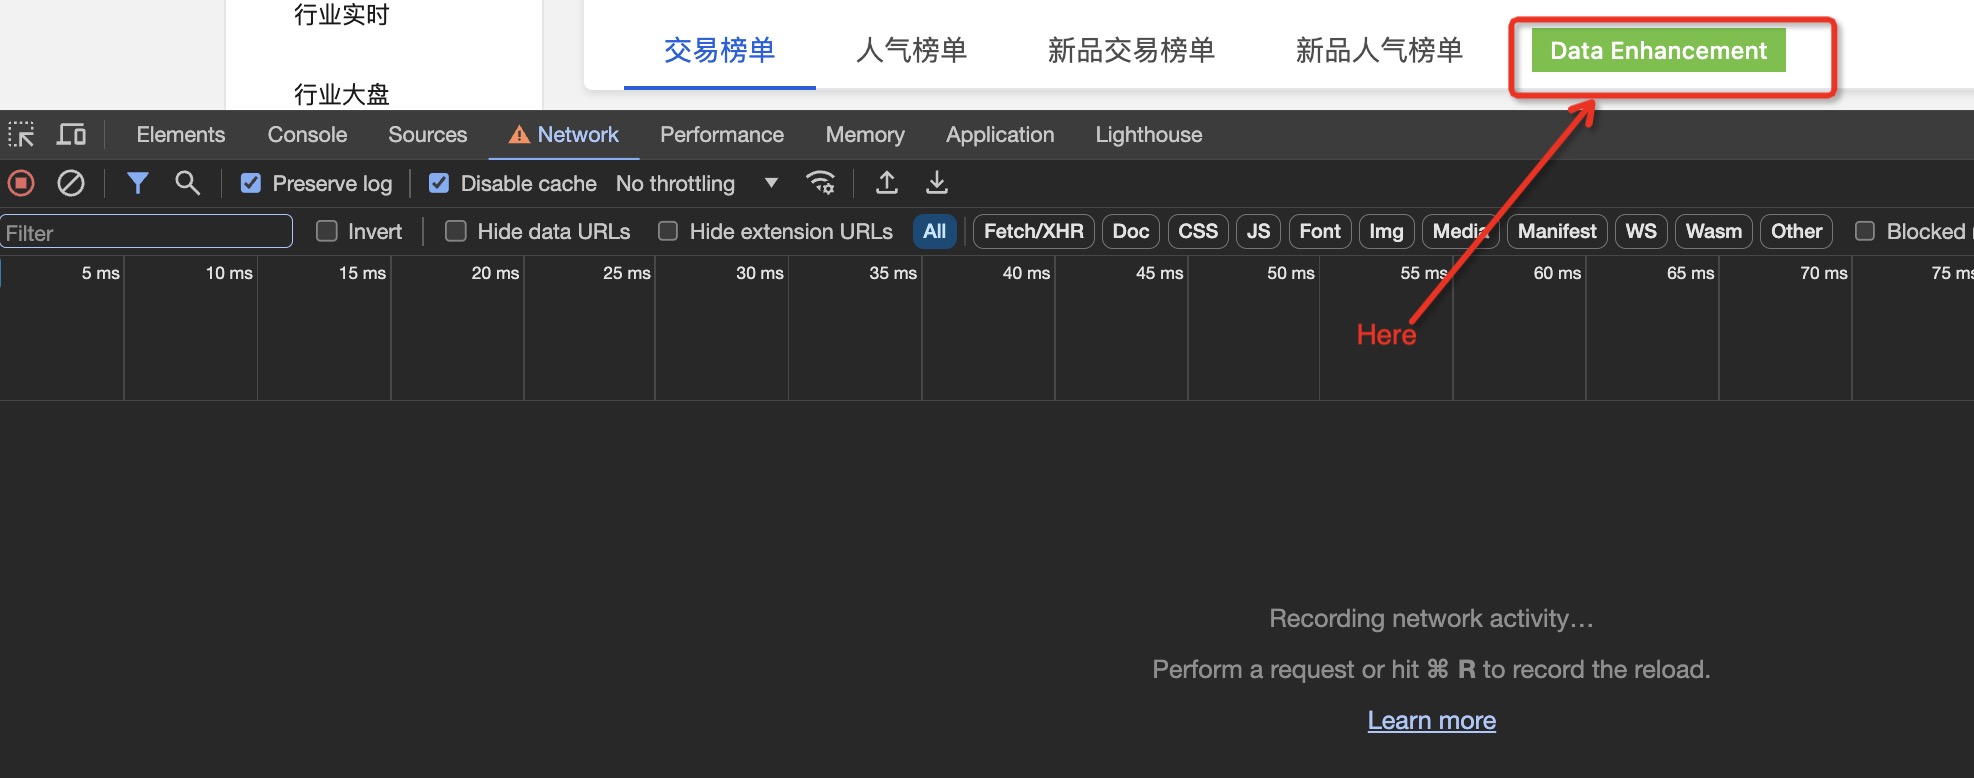
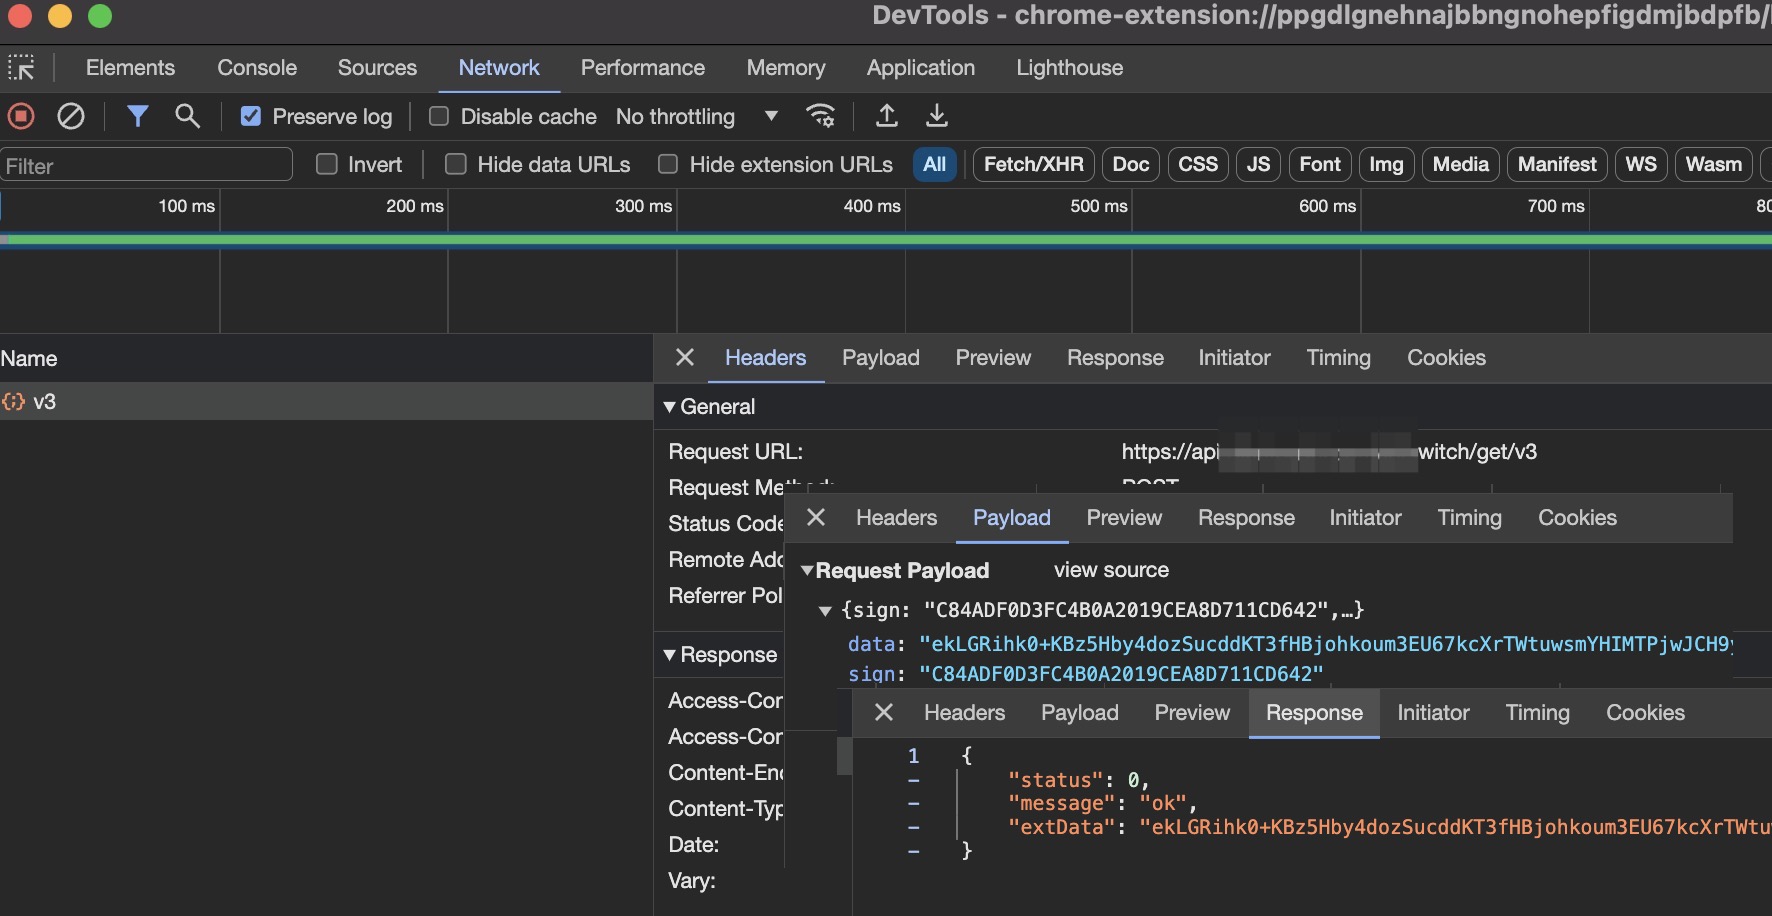
Now you can see the network activity of both the current webpage and the extension’s background page. Some extensions might automatically communicate with their server upon refreshing the page, while others might require user interaction. In this case, the extension adds a button to trigger communication, simply click it and observe the Chrome developer tools.
The developer tools should display a network request. You can see the request URL, payload, and response payload. However, both payloads are likely encrypted. To view the data, decryption is necessary.
3. Decrypt the data
The code for encryption and decryption is undoubtedly within the extension itself. Our goal is to locate it. The extension code is typically found in: /Users/argszero/Library/Application Support/Google/Chrome/Default/Extensions/xxx.
Replace “xxx” with the extension’s ID, which is found in the extension management page. You can use an editor like VS Code to open the extension code and search for the request URL throughout the codebase.
May be you are lucky to find it for your target extension.But I’m not so lucky.I can’t find it. Where is it? We know the brower can load javascript code dymatically, so , maybe the extension add some dynamic javascript code to the page we are browsing.
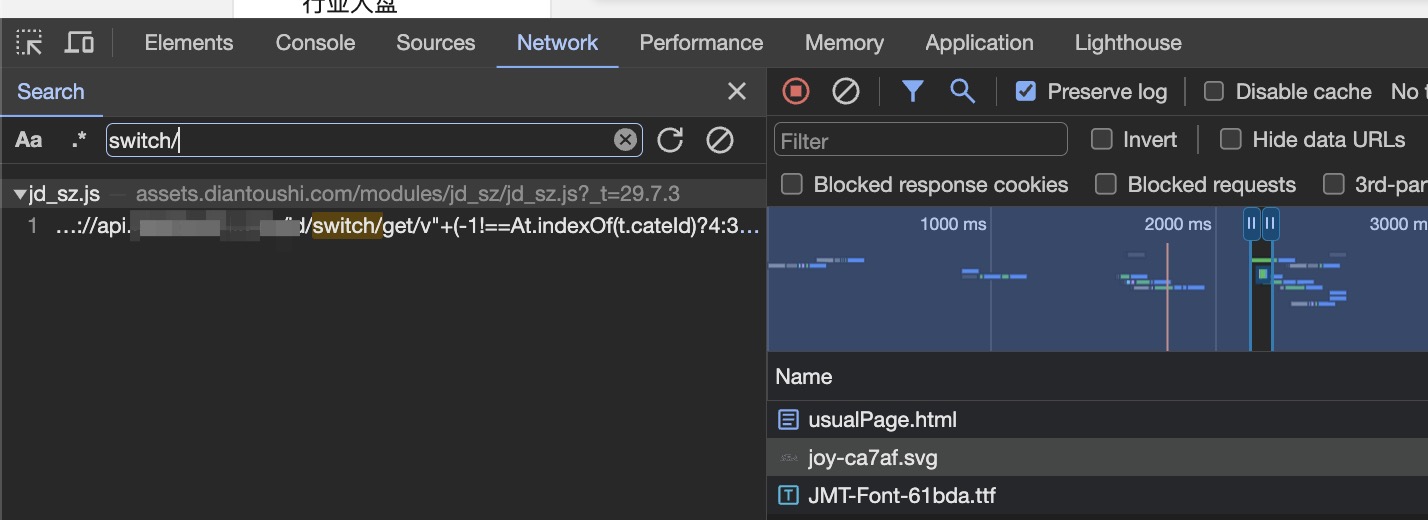
Back to the Chrome developer tools for the page we are browsing, focus on the Network tab, typing Command + F to Open the Search panel, and typing the request url in the search bar. As you can see, we can find it in one javascript file.
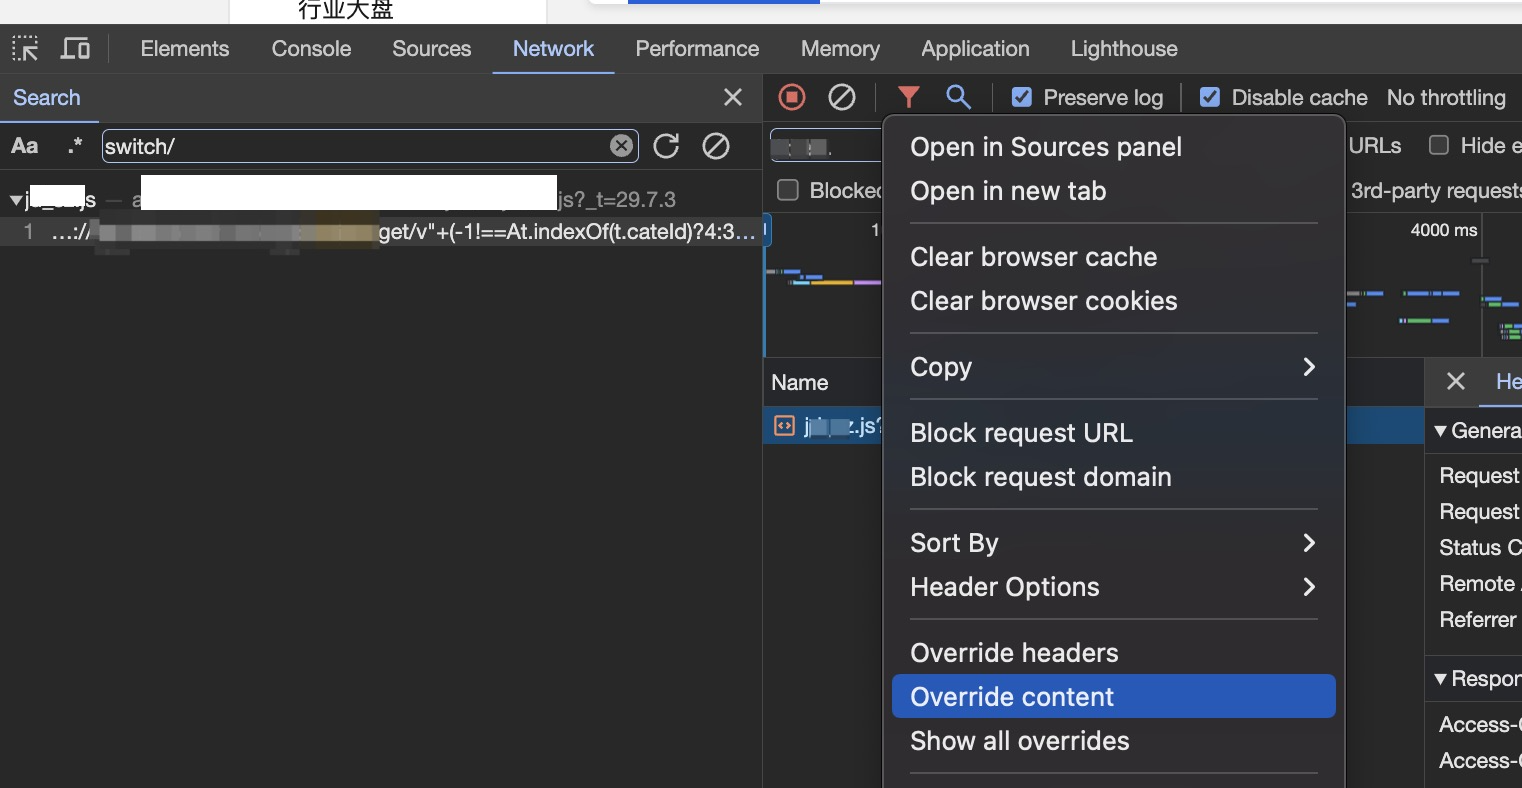
Find the script request in network tab. Right-click on the script request in the Network tab and select “Override Content”.
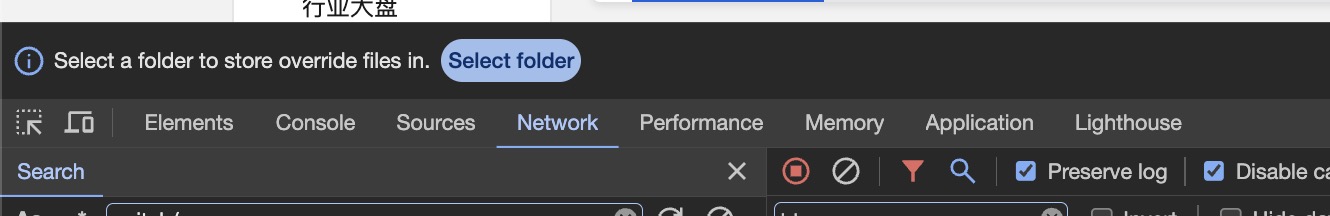
If this is your first time using this feature, a “Select Folder” button might appear at the top of the developer tools. Click it and choose a folder location.
Open the overridden content folder in VS Code and format the script code for better readability (the original code might be on a single line). After formatting the code, we can see the request is send in line 17858:
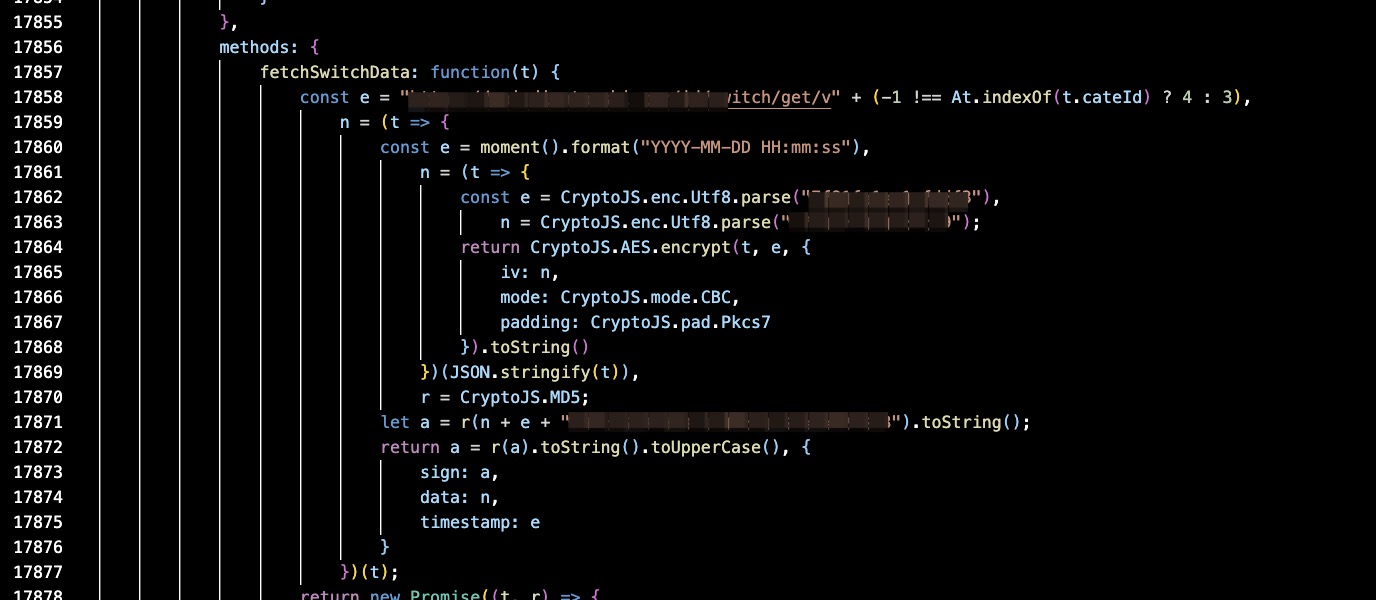
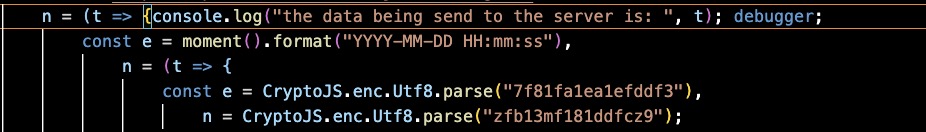
Here, the variable t holds the data sent to the server before encryption. We can log it to the console by modifying the script code as follows:

You can read about how the data is encrypted here.
Now we have the request data before encryption, but we also want to get the response data after decryption. As we saw earlier, the response data is encrypted and isn’t decrypted here. We need to find the code that uses the response data. We can modify the code again by adding debugger; here to trigger a debug action.
After saving the modified code, we can refresh the page and click the button again to enter the debug mode.
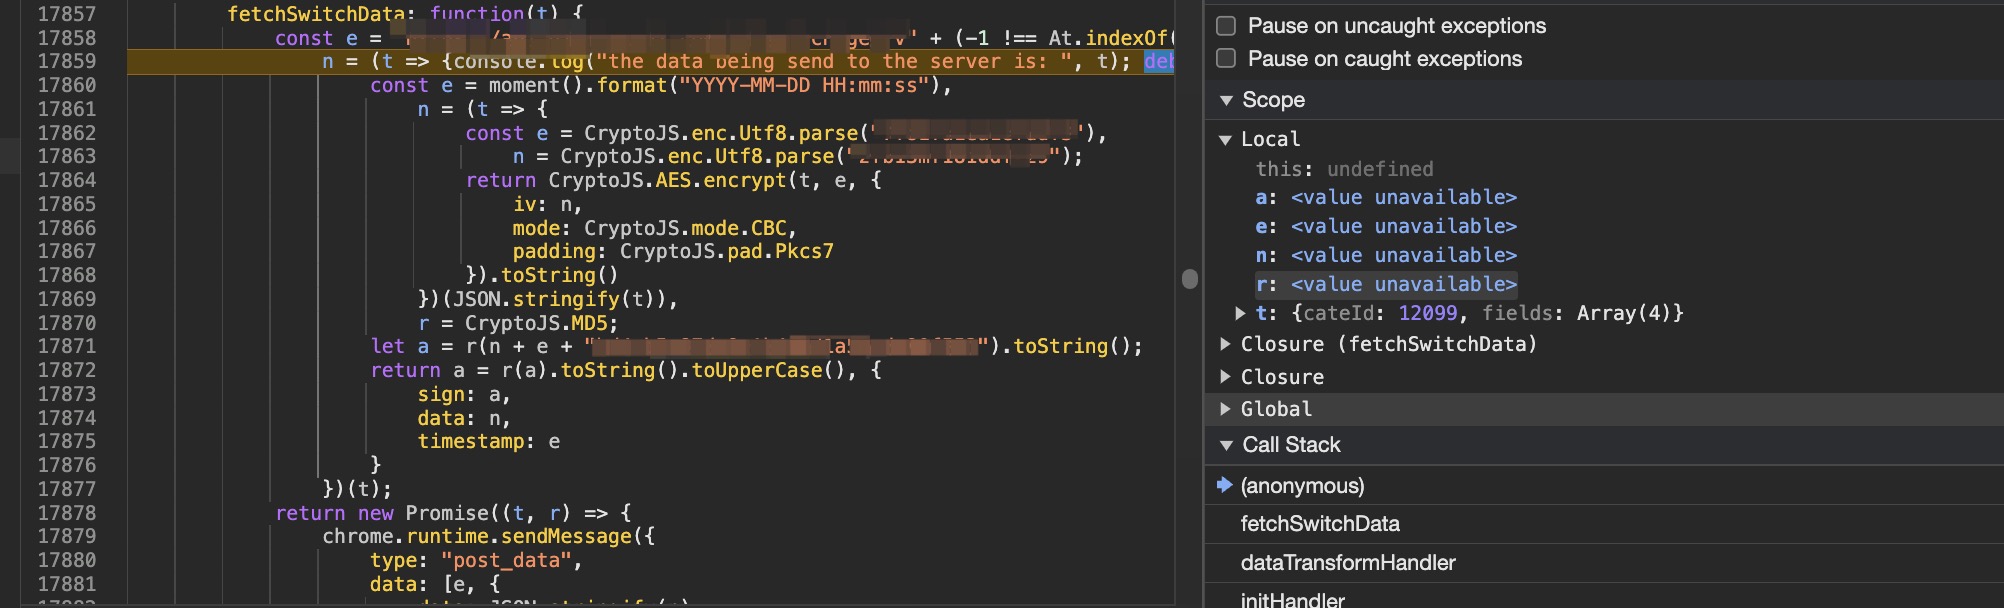
We can debug step-by-step and easily find the code for decryption.
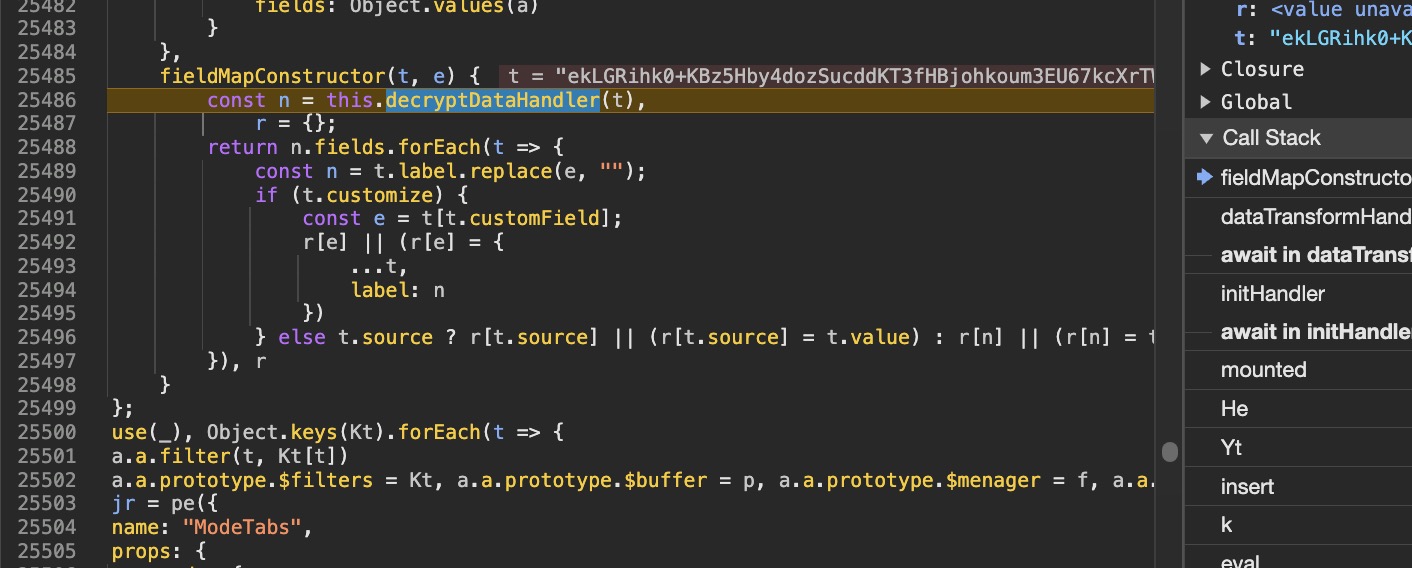
We can modify the code again to log the response data after decryption.
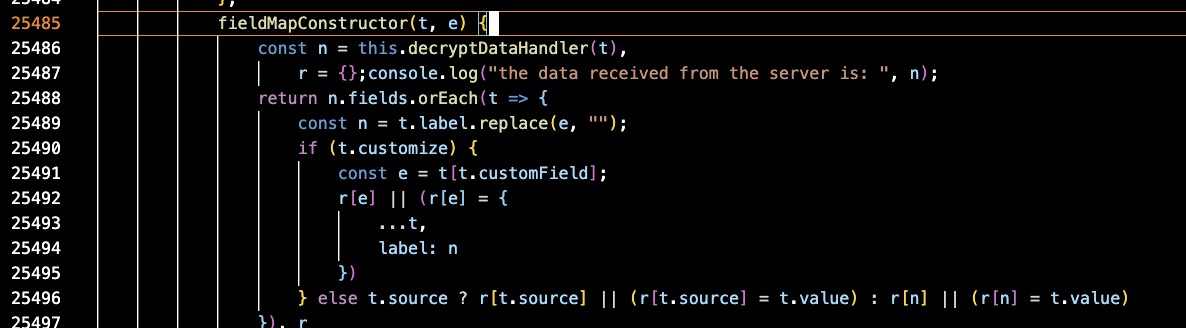
We can then step into the decryptDataHandler function to see the details of the decryption process.
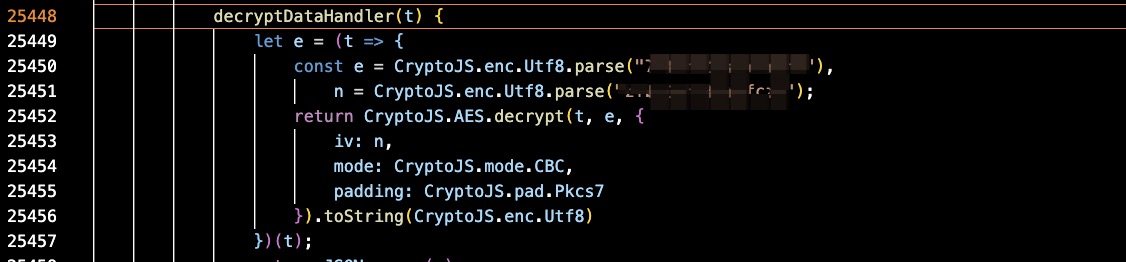
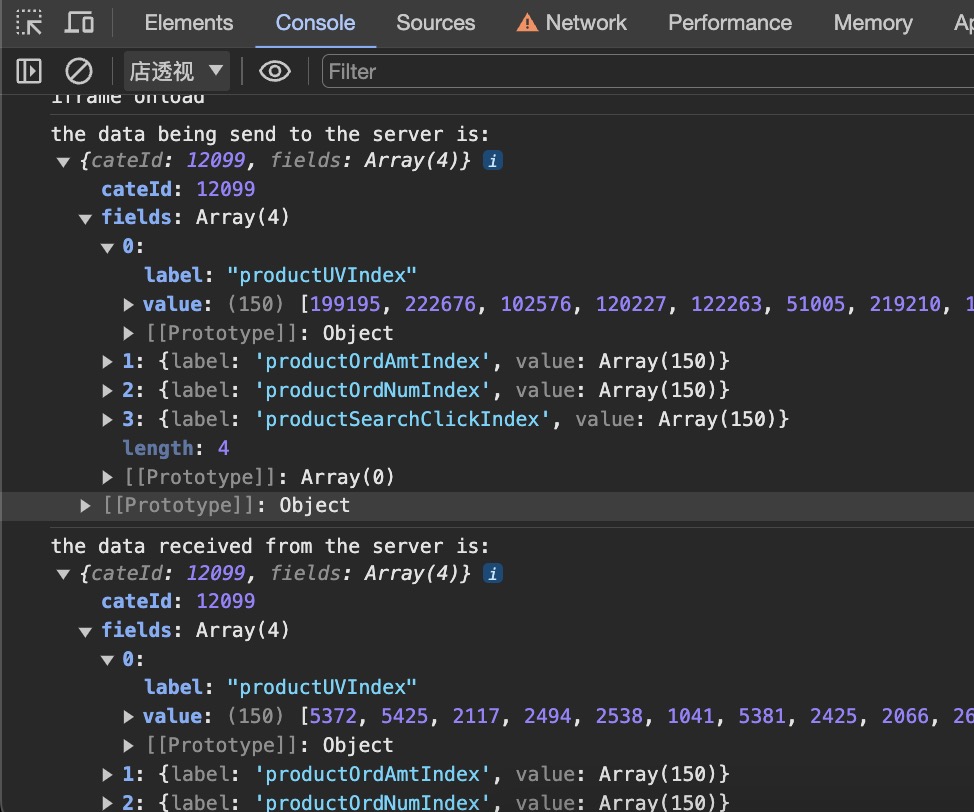
From the console panel, we can now see the raw data sent to the server and returned from the server!